Author: Kateryna Volkovska
"... ensembles of decision trees - often known as Random Forests - have been the most successful general-purpose algorithm in the modern times." Howard & Bowles (2012)

In this blog post, I want to draw your attention to the very interesting and useful algorithm called Random Forest. In econometrics, Random Forests are used in GDP forecasting and poverty prediction. Also, this approach can be used to rank the importance of variables/classifier in regression and classification tasks (variable selection method). Variables that enter more trees/models (note that this share of trees often called the importance score) are stronger predictors, than those that enter fewer trees.
CART (Classification and regression trees)
Random Forest can contain not only hundreds but thousands and more of individual trees. That is why in order to understand the concept of random forest, we should firstly define what is the single random tree.
The main idea behind CART is quite simple: a set of observed predictors is used to recursively partition the data until the values of the respond variable become homogeneous with each sub- partition (Ikonen, 2016). CART splits one variable at a time. The best partitioning variable at each split is determined by minimizing the sum of squared errors in regression or alternatively finding the predictor that best splits the response variable into separate classes in classification (Sikory 2009). When the best available split is found, the procedure continues until the minimum node size is reached.
Random Forests (RF)
Random Forest (alternatively - Decision Forest) is the complex of decision trees (tree predictors) in which each individual tree is constructed from a unique subset of data with randomly selected observations and variables. My motivation for studying this algorithm more detailed was that it gives good results in classification and regression problems. For example. in the study by Caruana et al. (2008) indicated that Random Forests offer the most accurate and stable results.
Random Forests are known to be highly resistant to over-fitting and to effectively handle the noise (Payne, 2014). Due to the majority voting, the algorithm also efficiently deals with the common problem in econometrics - heteroscedasticity. Random Forests also expand upon the strengths of standard decision tree predictors in detecting non-linearity in the data and working with the high-dimensional data sets (Siroky, 2009; Caruana et al. (2008)).
Hare are the very intersting illustrations from the lecture slides of Cutler (2010) about how the Random Forest captures the data. Suppose we have the following data and underlying function:

Hare are the very intersting illustrations from the lecture slides of Cutler (2010) about how the Random Forest captures the data. Suppose we have the following data and underlying function:

That s how the single regression tree deals with data:

And if to take 10 regression trees:


Let´s have a closer look at how the algorithm works.
How it works: intuition
The algorithm proposes to select randomly the subsets of the data and "grow" the decision tree on them independently. At the last stage, it combines this decision trees and aggregates their predictors by majority voting, or simply, averaging. Interesting explanation I have found in the Biau and Scornes (2010): the algorithm rules by "divide and conquer" principle - you should sample the small fractions of data, grow a randomized tree predictor on each small piece and then paste (aggregate) these predictors together. Thereby, the group of weak models combines to form a quite powerful model.
Now let´s look at my super-simple example in order to understand the intuition behind. Suppose Sally have her own criteria of an ideal boyfriend. The factors that influence her decision are age, whether he is smart or not, whether he is cool or not and whether he is handsome. Now we build three decision trees according to Sally´s preferences:


 Then Sally meets a man (new object for the procedure) who has features: 20-30 years, handsome, cool but, unfortunately, not smart :(
The results from each tree are the following: decline, accept, decline. Therefore, using the majority rule (2 declines against 1 accept) - Sally will reject this guy :( So being smart is really important.
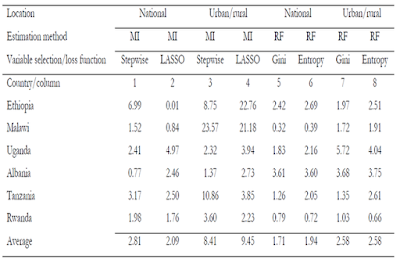
Now let´s study a more complex example. Sohnesen and Stender (2016) examined the problem of poverty and found that Random Forest often has higher accuracy and, in particular, good predicts in the rural/urban areas. In the example, they examined 6 countries: Albania, Ethiopia, Malawi, Rwanda, Tanzania and Uganda and compared the performance of Random Forest versus the other common tool for predicting poverty - Multiple Imputation (MI).
To do this they build 6 models of MI and RF with different variable selection methods and loss functions and compared the prediction accuracy:
Now let´s look at my super-simple example in order to understand the intuition behind. Suppose Sally have her own criteria of an ideal boyfriend. The factors that influence her decision are age, whether he is smart or not, whether he is cool or not and whether he is handsome. Now we build three decision trees according to Sally´s preferences:


The results from each tree are the following: decline, accept, decline. Therefore, using the majority rule (2 declines against 1 accept) - Sally will reject this guy :( So being smart is really important.
Poverty prediction
Otok and Seftiana (2014) concluded that Random Forest performs nicely in defining poor households. At the same time, Thoplan (2014) found that this algorithm predicts poverty quite accurate.Now let´s study a more complex example. Sohnesen and Stender (2016) examined the problem of poverty and found that Random Forest often has higher accuracy and, in particular, good predicts in the rural/urban areas. In the example, they examined 6 countries: Albania, Ethiopia, Malawi, Rwanda, Tanzania and Uganda and compared the performance of Random Forest versus the other common tool for predicting poverty - Multiple Imputation (MI).
To do this they build 6 models of MI and RF with different variable selection methods and loss functions and compared the prediction accuracy:
- RF using Gini impurity function
- RF using Entropy loss function
- MI with Stepwise variable selection
- MI with LASSO variable selection
- MI with 25 variables based on the importance score from RF
- RF with 25 variables based on the importance score from RF.
Table 1. Mean squared error of poverty predictions for different variable selection methods and RF loss functions.

Source: Sohnesen and Stender (2016)
Analysis of the forecasting performance of the linear regression based models an RF shows that both approaches do well at the national level (both patterns are fairly similar), but RF are in general more accurate. It has higher accuracy in 4 out of 6 countries and does better at the mean (Column 7 and 8 vs 3 and 4).
Sohnesen and Stender (2016) also conclude that RF is more robust and does not make large prediction errors at rural/urban levels unlike commonly applied linear regression models.
To summarize:
Advantages
- The great pros of Random Forests are that the effects of heteroscedasticity, outliers, and other data anomalies are reduced due to the large amount of individual tree learners and majority voting (Breiman, 2011).
- The algorithm provides unbiased estimates of model generalization error.
- Excellently performs when the number of variables is much larger that the number of observations
- Very accurate approach and excellent classification algorithm.
- More robust predictor as it does not rely only on the one prediction model.
- Particulary well-suited to the small sample size and large p-value problems.
- Detect nonlinear relationships and good works with the high dimensional datasets (Siroky, 2009).
Problems
- In big trees we can face the problem of over-fitting and, as the consequence, problems with generalizing the structure as the tree can be too much detailed.
- In small trees we can be unable to capture the essential details in the data, some important specifications can be missed.
- Rather slow and mathematically complex algorithm.
- So-called "black box": quite hard to get insights into decision rules.
Software & Languages
- R (package randomForest: functions "randomForest" and "varlmpPlot")
- Python (package Anaconda)


